Calculate Risks
Guidance
This document presents the steps involved in analyzing risks:
Risk—the potential for loss, damage, or destruction of power system assets or other key resources resulting from exposure to a threat. Risk is evaluated as the product of the threat likelihood score and the vulnerability severity score.
1. Assess Risks
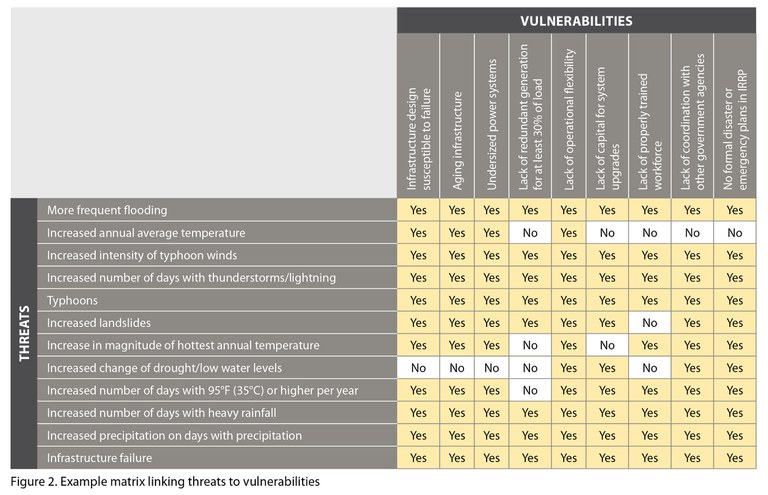
Not all threats directly influence each vulnerability. As such, the first step involves determining which threats and vulnerabilities are associated. The matrix shown in Figure 2 is one way to do this.
Training Materials: Risk Introduction
These slides are intended to provide additional background information on how to assess and evaluate risks to the power system.
2. Score Risks
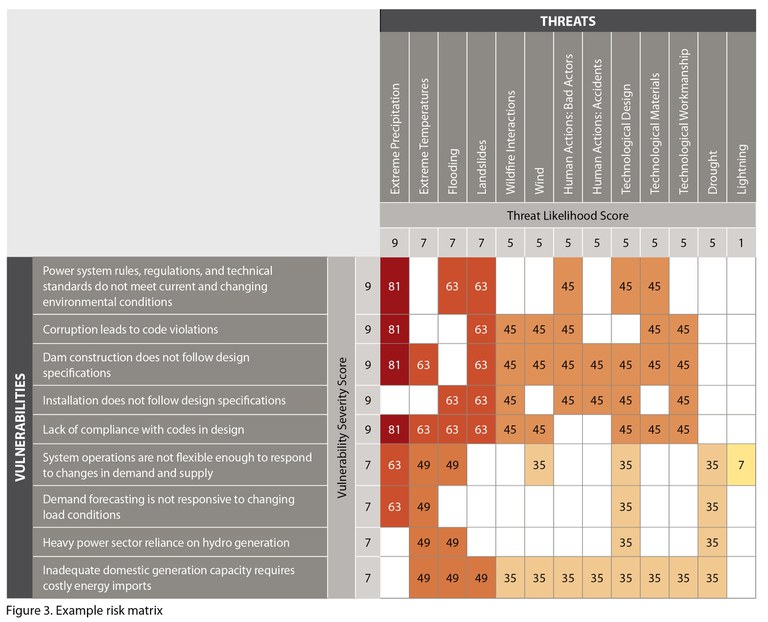
There are many different methodologies for scoring risk. The method highlighted here is based on that developed by Anderson et al, 2018, and uses risk matrices to score and prioritize risks. Risk matrices show the relationships between threats and vulnerabilities. The severity score for each vulnerability is multiplied by the threat likelihood score to create a risk score for each specific threat-vulnerability combination. Risk scores are scaled from one to 100, with higher scores corresponding to higher risks. This requires assigning quantitative values to the qualitative thresholds previously presented in the threat and vulnerability sections of this guidebook. The risk is calculated as:
Risk score = Threat likelihood score X Vulnerability severity score
Developing a risk matrix provides a structure for combining scores in a meaningful way that enables analysis and ranking of the risks to prioritize mitigation actions. No risk score is assigned where threats are not associated with a vulnerability, and the matrix is blank at this intersection. The final risk score is shown in the matrix and used to prioritize the vulnerabilities (Figure 3).
Activity: Country Risk Assessment
This worksheet can serve as a guide to assess risks to your power sector by linking and scoring the vulnerabilities and threats you determined in previous activities.
3. Evaluate Risks
The heat map (Figure 3) portrays high-risk scores as red cells (top left) and low-risk scores as orange or yellow values (bottom right). Blank cells indicate a lack of connection between that combination of a threat and vulnerability. This format helps in displaying the relative importance of different risks and provides insight into potential causes of—and vulnerabilities to—disruptive events. This can also enable decision makers to identify tailored resilience solutions for certain vulnerability-threat combinations. For example, a decision maker could weigh specific vulnerabilities against the likelihood of different threats and be well-positioned to direct resources to priority areas.
4. Identify levels of risk acceptance
A comprehensive risk evaluation will likely yield far more threat-vulnerability pairs than can be addressed. In this case, the next step of the assessment involves using experience and professional judgment to form a plan for how many and on which of these pairs to focus. Making these decisions serves to identify what threshold of risk is tolerable and possible, and which threat-vulnerability pairs are critical and feasible to address.
In this decision-making process, some factors to consider are:
- Which vulnerabilities are affected by the largest number of risks?
- Whether priority will be given to the high-frequency risks or the highest-impact risks.
- What level of risk is the power sector capable of realizing—financially, technologically, and logistically?
After the decision makers have identified these levels of risk acceptance and focused their list of priorities, they should be sure to re-engage relevant stakeholders for feedback, amendments, and approval.
Resources:
Activities
Country Risk Assessment
In this activity, you will assess risks to your power sector by linking and scoring the vulnerabilities and threats you determined in previous activities.
Training Materials
Risk Introduction
These slides are intended to provide additional background information on how to assess and evaluate risks to the power system. They can serve simply as a reference or can be used in local power sector resilience assessment workshops.
Data and Tools
Publications and Case Studies
Planning a Resilient Power Sector
The provision of reliable, secure, and affordable electricity is essential to power economic growth and development. The power system is at risk from an array of natural, technological, and man-made threats that can cause everything from power interruption to chronic undersupply. It is critical for policymakers, planners, and system operators to safeguard their systems and plan for and invest in the improved resilience of the power sector in their countries. Through holistic resilience planning, actors can anticipate, prepare for, and adapt to the threats and stresses on the power system. Resilience planning identifies the threats, impacts, and vulnerabilities to the power system, and devises strategies to mitigate them.
Quantifying and Monetizing Renewable Energy Resiliency
This article highlights the unique value renewable energy hybrid systems (REHS), comprised of solar, energy storage, and generators, provide in increasing resiliency. We present a methodology to quantify the amount and value of resiliency provided by REHS, and ways to monetize this resiliency value through insurance premium discounts. A case study of buildings in New York City demonstrates how implementing REHS in place of traditional backup diesel generators can double the amount of outage survivability, with an added value of $781,200. For a Superstorm Sandy type event, results indicate that insurance premium reductions could support up to 4% of the capital cost of REHS, and the potential exists to prevent up to $2.5 billion in business interruption losses with increased REHS deployment.
This paper reviews current practices for calculating the value of resilience with a focus on valuing resilient DERs installed within the distribution system. It examines both regulatory decision-making and non-regulatory cost-benefit analyses in order to determine if, and how, a value of resilience was calculated and applied. The paper is designed to address questions that utility regulators have identified as being of interest.
Fourth National Climate Assessment Chapter 4: Energy Supply, Delivery, and Demand
The Fourth National Climate Assessment (NCA4) focuses on the human welfare, societal, and environmental elements of climate change and variability for 10 regions and 18 national topics, with particular attention paid to observed and projected risks, impacts, consideration of risk reduction, and implications under different mitigation pathways. This assessment was written to help inform decision-makers, utility and natural resource managers, public health officials, emergency planners, and other stakeholders by providing a thorough examination of the effects of climate change on the United States.
Chapter 4 of this report focuses on energy supply, delivery, and demand: The Nation's energy system is already affected by extreme weather events, and due to climate change, it is projected to be increasingly threatened by more frequent and longer-lasting power outages affecting critical energy infrastructure and creating fuel availability and demand imbalances. The reliability, security, and resilience of the energy system underpin virtually every sector of the U.S. economy. Cascading impacts on other critical sectors could affect economic and national security.
This report addresses the topics of measuring and increasing energy resilience, including definitions, means of measuring, and analytic methodologies that can be used to make decisions for policy, infrastructure planning, and operations. A risk-based framework is presented which provides a standard definition of a resilience metric. Additionally, a process is identified which explains how the metrics can be applied. Research and development is articulated that will further accelerate the resilience of energy infrastructures.
Climate Change Vulnerability Mapping for Southeast Asia
This paper provides information on the sub-national areas (regions/districts/provinces) most vulnerable to climate change impacts in Southeast Asia. This assessment was carried out by overlaying climate hazard maps, sensitivity maps, and adaptive capacity maps following the vulnerability assessment framework of the United Nations’ Inter-governmental Panel on Climate Change (IPCC). The study used data on the spatial distribution of various climate-related hazards in 530 sub-national areas of Indonesia, Thailand, Vietnam, Lao PDR, Cambodia, Malaysia, and the Philippines. Based on this mapping assessment, all the regions of the Philippines; the Mekong River Delta in Vietnam; almost all the regions of Cambodia; North and East Lao PDR; the Bangkok region of Thailand; and West Sumatra, South Sumatra, West Java, and East Java of Indonesia are among the most vulnerable regions in Southeast Asia.
The African Risk Capacity (ARC) is a Specialized Agency of the African Union established to help African governments improve their capacities to better plan, prepare, and respond to extreme weather events and natural disasters. Through collaboration and innovative finance, ARC enables countries to strengthen their disaster risk management systems and access rapid and predictable financing when disaster strikes to protect the food security and livelihoods of their vulnerable populations.
Rebuild by Design convenes a mix of sectors - including government, business, non-profit, and community organizations - to gain a better understanding of how overlapping environmental and human-made vulnerabilities leave cities and regions at risk. Rebuild’s core belief is that through collaboration our communities can grow stronger and better prepared to stand up to whatever challenges tomorrow brings.


